Sunday, August 8, 2010

Did Somebody Say XBT Party?

I did!! What is an XBT, you ask? Well, XBT stands for Expendable Bathythermograph Probe and it is a disposable temperature probe that the science team launches from the boat once every twenty-four hours. Our XBT brand of choice is made by Lockheed Martin Sippican Proprietary, and comes in two different flavors, T-5(max depth of 1830m, max vessel speed of 6 knots) and T-7(max depth of 760m, max vessel speed of 15 knots). But what does an XBT do and what can it tell us? Well, an XBT actually contains a wire link which transmits data to our main lab's computer, which in turn stores information on depth versus water temperature and depth versus sound velocity. This data can then be pooled together from several different research vessels to compile weather and climate forecasting as well as climate research. But why would we care about sound velocity in the water? Once we can calculate accurate estimates of the speed of sound through water, scientists can then use this information to create more precise bathymetric maps. To demonstrate how these depth vs. temperature and depth vs. sound velocity profiles can vastly change across an ocean basin I present some of our recent findings: the first set of profiles, in red, were collected at the beginning of the trip in close proximity to Oahu. The next set, in blue, were collected off the coast of Japan in transit back to our study area.

Thursday, August 5, 2010

An update

Around the noon time on July 30th, there was a medical emergency, which warranted the immediate stoppage of all science operations. Unfortunately, the person who had the emergency was officially pronounced as deceased at ~2PM, and soon after Langseth got underway for Yokohama, Japan. The vessel arrived in Yokohama four days later (August 3rd, or August 4th in Japan Standard Time), and after offloading the remains of our deceased crew member, we started our return to Shatsky Rise. We're currently still in transit. NSF very generously granted us a 7-day extension to minimize the loss of science days caused by this Yokohama transit. With the current speed (10-11 knots), we expect to return to where we stopped, by the afternoon of August 7th.

Our sympathies go to the family of the deceased crew member, and we are grateful for those who were involved in the cruise rescheduling.

Monday, August 2, 2010

The Magnetic Barcode of the Seafloor

Hello! My name is Duayne Rieger and I am starting on my third year as a PhD student in Geology and Geophysics at Yale University. My research interest is seismic anisotropy in Earth’s upper mantle and its relation to global tectonics. Today however, I am going to talk about magnetics data that can be collected out at sea, rather than seismic data, being that there will be plenty of time to talk about the seismic data we are collecting.

As we cruise through the open pacific, over the Shatsky Rise, we are making measurements of Earth’s magnetic field strength. The reason for collecting these data is to observe anomalies in Earth’s magnetic field strength that are produced by rocks in the seafloor. By measuring these anomalies, we can gain insight into the age and history of the seafloor. Here is how!

At spreading ridges, where two oceanic plates diverge from one another, new oceanic crust is formed through the partial melting of Earth’s upper mantle. As the new oceanic crustal rocks freeze from the partial melts, the magnetic minerals in the rocks take on the orientation of (or align with) the Earth’s magnetic field. If Earth’s magnetic field remained constant in time, than the entire seafloor would possess the same magnetic orientation. However, throughout Earth’s history its magnetic field has not been constant but in fact has been reversing. A magnetic reversal is where the magnetic north and south poles of Earth switch positions. Because, as just mentioned, oceanic crust takes on the magnetic orientation of the Earth’s field at the time of its formation, these reversals in Earth’s magnetic field can be seen in lines of reversing magnetic orientation along the seafloor that are parallel to the spreading ridge. This process is illustrated in the figure above.

So when making magnetic field strength measurements, the measurements will be slightly larger when we are over oceanic crust that possesses the same magnetic orientation as the Earth currently does and will be slightly smaller when over seafloor with the opposite magnetic orientation. Then by knowing when these magnetic reversals happened in Earth’s history, we can learn more about the age of the seafloor.


The magnetic lineations around the Shatsky Rise are very interesting. They present evidence that the Shatsky Rise was formed at a triple junction. A triple junction is where three, rather than two, oceanic plates spread apart from each other from three different ridges. The magnetic lineations around a triple junction are not all parallel to each other, as you would expect if the seafloor were produced at one ridge, but in fact have angles in them to match the geometry of the multiple spreading ridges. This is illustrated in the figure to the left.

The bottom figure is a bathymetric map of the Shatsky Rise with the magnetic lineations included. The red lines in the figure are there to illustrate the angle in the magnetic lineations. Since the magnetic lineations around the Shatsky rise have an angle in them, scientists have reason to believe that it was formed at an ancient triple junction. Magnetic lineations around other oceanic volcanoes (also know as Large Igneous Provinces) may suggest that they too were created near ancient triple junctions. Is there a connection between oceanic super volcanoes and triple junctions? That is one of the many questions that we are out here to answer!


Saturday, July 31, 2010

Some observations on some of the data collected thus far

Before we get to the science, a brief introduction of myself. My name is Dan'l Lewis and I am a new Master's student at Texas A&M University in the Department of Oceanography. My areas of interest are marine geology, geophysics, and plate tectonics and my fields of interest in particular is seismic interpretation of marine geology. I am on this cruise courtesy of my advisor, Will Sager, and two more of his students, Sam and Chris. A big thank you for the invite to come along.
That being said I will now move to the science. As we have traveled from Hawaii to the rise we have taken numerous measurements at regularly spaced intervals. As we are still shooting, the refraction lines it will still be several days before we can begin processing any seismic reflection lines. In the meantime, I have compiled a few charts of data as we progress westward across the Pacific towards Shatsky Rise and these data will continue to be collected throughout the process. The data I will talk briefly of today in particular is temperature versus latitude and temperature versus longitude. Unfortunately I could not grab the plots before this post was made and I will try to add them at a later date. It is noticed that there is an increasing trend as one moves from east to west across the western Pacific. The temperature also fluctuated but I assumed some of that was daily heating and cooling. However, as we have progressed westward at several points we hit areas of far colder water than the surrounding waters. Our time through these cold eddies is brief maybe an hour at most but it is of interest that there is almost a degree of difference in water temperature. It may not seem like much but if you compare it to the human body temperature, raising or lowering a few degrees can have quite an impact. I'm not sure what exactly these cold spots are and what there relation to currents throughout the Pacific are, but hopefully as my studies in Oceanography progress, I can shed some light on them. Or perhaps someone can enlighten me with why there are these cold upwellings in seemingly random places. Once again, I apologize for not posting the chart, but I will try to post it as soon as possible.

*edit* They are up now. The data is organized such that it matches the track i.e. the right side of the chart is Hawaii and the left side is Shatsky Rise. I believe the negative spike in the data on the right was us coming off of the Hawaiian Swell. Also to note is the longitude values are based around 0. Excel was not smart enough to allow 180 to be a center value and my GMT skills are lacking, but the image produced still gets the point across. Again apologies for the delay.


Friday, July 30, 2010

Sunset on the sea

I am Kai Gao, a Ph.D. graduate student from the Department of Geology and Geophysics at Texas A&M University. I joined TAMU G&G last August and now I am working with Dr. Gibson on exploration seismology. My current research is mainly about the velocity-confining pressure relationship for cracked rocks. Basically, I am developing a set of equations describing how the P- and S-wave velocities change of different cracked rocks under confiniing pressure, and do corresponding cracks parameters (e.g,, crack density, matrix velocity, etc.) inversions if given experiment data of pressure-velocity. According to the current results I got, this relation is neither linear nor simple nonlinear, it can be approximated by power-law-based square-root relation. Anyway, perhaps you can see my results someday in some journal. I also hope that will not be too far away.

Shifting to the Shatsky cruise, we have finished dropping OBSs on predesigned sites across Shatsky Rise and now we are implementing over 1000 air gun shootings along the first line (in fact it includes a long seismic line nearly NW-SE and a short line perpendicular with it), and we expect to finish the shooting tomorrow, and then Langseth will utilize streamers along with air guns to explore several other seismic lines over different regions of Shatsky Rise. It is exciting that this is the first time that human beings can detect deeply inside this supervolcano other than merely understanding the shallow sediments. See a detailed report from Oceanography TAMU.

This vast ocean is never mean to bequeath its pulchritude in the endless time. Every moment is its never-returning past, every moment is its ever-extending verve to the future, even when the sunset is coming and try to cover the ocean with black night. The sunset itself is an evanesce, while it is an undying dazzling impression for me, just like an opera performed by the sun and our earth.


Thursday, July 29, 2010

Intro to MMO ( Marine Mammal Observers)


I guess you may not know there is someone studying animals on our seismic survey ship. Animals and seismics? What relationship? Actually, they have. And they have much more power than you could expect. The marine animal folks have the right to stop our seismic survey at any time when applicable. Who are they? Let me introduce to Marine Mammal Observers (MMO).
Marine seismic survey requires the transmission of strong acoustic pulses into the water, done by suddenly releasing compressed air from an array of air-guns. Although the acoustic energy attenuates with increasing distance down to the seafloor or horizontally spreading, some of the pulses are still strong enough to be detected by marine mammals and other marine animals at distance of about 50-100 km, and have potential to disturb them like whales in the study area. And disturbance events will result when marine mammals or sea turtles near the seismic activities are close enough that they might experience temporary reduction in their hearing sensitivity or react behaviorally to the sounds generated. That is why MMOs show up during our seismic cruise, under the U.S. Marine Mammal Protection Art (MMPA) to minimize the disturbance of marine mammals. However, no serious injury and/or death is anticipated fortunately. (More information)
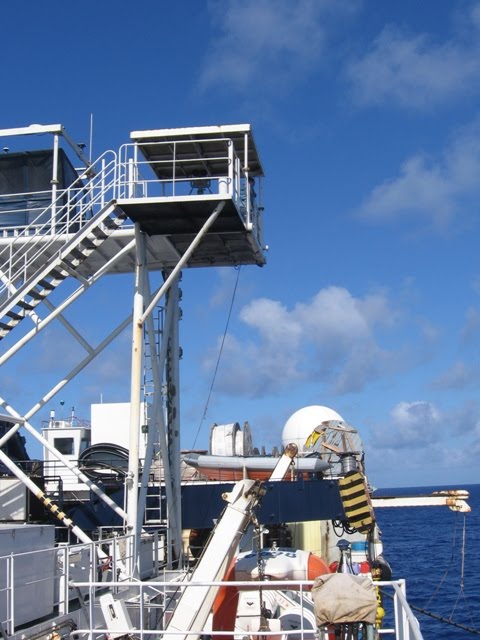
Pictures shown here are the observing station on the very top of the boat and one of the MMO group watching carefully with 'Big Eye' equipment to make sure no marine mammals appear within potential disturbing distance. If not! They will call stop the air-gun shooting, and all of us are forced to have a break.

Tuesday, July 27, 2010

My new found respect for seismic data

Me in the orange helmet with the WHOI deployment team
Hello everyone and welcome back to the Shatsky blog. It's my post today, and I'll do a quick introduction. I am Tolulope Olugboji, an international graduate student at Yale University. I work with Jun Korenaga (chief scientist on this research cruise), and my research work so far has involved using seismic data to study the crustal structure and origin of large under-sea super volcanoes. This involves me processing seismic data and using these data with inversion techniques to create images of the crust underneath the ocean sea floor. This procedure is known as tomography. Yea, I know, I tried to be brief.

Now that you know me, I have exciting updates from the Shatsky cruise. One is that I finally got my sea legs! This is a big deal for me, because if my body hadn't adjusted to the constant motion of the sea, I would have missed all the action that started yesterday on the Langseth. The high point was when I got to launch the very first ocean bottom seismometers (OBS) to be used for the tomographic imaging of the Shatsky crust. It was also a very important educational experience because it made me realize the value of seismic data. I have worked with seismic data for a while now, but I never appreciated the whole process that goes into acquiring the data.

Each OBS launch requires the participation of almost everyone on the ship. The navigation crew, the main lab, the deployment team and I am sure some other crew members that I still don't know about. The process is delicate and technical. The precision, organization, teamwork and time needed for deployment and recovery has given me a new found respect for seismic data. My take home message: learning about Earth's history and inner workings takes the dedication and commitment of a lot of people. Kudos to everyone on the Langseth. I promise to treat our data well.